Monitoring Pharos Alerts
![]() Any system problems that occur are recorded in one of
two places: the Windows Events log, and the Pharos Alerts log. Problems
that occur with a Pharos service on startup are written to the Events
log; all other problems with the Pharos system that occur at any other
time are listed in the Pharos Alerts log.
Any system problems that occur are recorded in one of
two places: the Windows Events log, and the Pharos Alerts log. Problems
that occur with a Pharos service on startup are written to the Events
log; all other problems with the Pharos system that occur at any other
time are listed in the Pharos Alerts log.
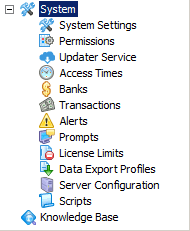
Once logged, Pharos alerts are displayed in the Alerts context of Pharos Administrator, under the System context tree:

A number of details are recorded for each alert, which can help to diagnose and remedy the problem that caused the alert to be generated in the first place.
The following details are logged for each alert, and displayed on the General category of the Alerts context:
- The Logon ID of the user who was logged on at the time of the alert (if relevant).
- The network name or IP address of the PC on which the Alert occurred.
- The date and time when the Alert occurred.
- The particular application or operation is causing the Alert, if this information is available.
The following details about the error that resulted in the alert being generated are recorded on the Error Description category of the Alerts context:
- The severity of the error
- The numerical error code for the Alert. Refer to the Alert Code Index in the Pharos Help for more information.
- The description of the error captured by the Alert.
In addition it also provides the details about the Server that generated the Alert. It includes the following Server details:
- The Server from where the Alert originated.
- The Pharos Service running on the Server with which the problem was associated.
- The operation at the time the problem occurred, for example, Startup or Logon.
All Pharos Alerts have an associated error code, which identifies the problem that has occurred. Extra information for each error code is available in the Pharos Alert Error Codes topic of the Uniprint Help. Using the Pharos Alert Error Codes search option, you can locate an error code and view the information associated with it.
Viewing Alert Details
A number of details are recorded for each alert, which can help to diagnose and remedy the problem that caused the alert to be generated in the first place. All details are read-only. Selecting the "Knowledge Base" option on the Actions pane opens the Pharos Knowledge Base, searching for any articles that relate to the currently selected alert.
Alerts Details
The following details are logged for each alert, and displayed on the General category of the Alerts context:
General
| Property | Description |
|---|---|
|
User |
The Logon ID of the user who was logged on at the time of the alert (if relevant). |
|
Client |
The network name or IP address of the PC on which the Alert occurred. |
|
When |
The date and time when the Alert occurred. |
|
Item |
The particular application or operation causing the Alert, if this information is available. |
Error Description
The following details about the error that resulted in the alert being generated are recorded on the Error Description category of the Alerts context:
| Property | Description |
|---|---|
|
This field records the nature of the event as one of the following:
|
|
|
Error Code |
Numerical error code for the Alert. See the Alert Code Index in the Help for information on what each error code means |
|
Message |
A description of the error captured by the Alert. If the displayed description text is truncated, place the mouse pointer over it to see the full text. |
Service
The following details about the server that generated the alert are displayed on the Service category of the Alerts context.
| Property | Description |
|---|---|
|
Server |
The name of the Server where the Alert originated. |
|
Service Type |
The Pharos service running on the server with which the problem was associated. The service is recorded as one of:
Where PS = Pharos, Svr = Server, CC = Change Control Port |
|
Operation |
Shows what was happening at the time the problem occurred, e.g. "Startup" or "Logon". |